
Cockpit
Data analysis tools to aid management.
Now that your data have been correctly uploaded, matched up, checked and enriched, you have everything you need to analyse them and base your decisions on reliable and up-to-date data.

Now that your data have been correctly uploaded, matched up, checked and enriched, you have everything you need to analyse them and base your decisions on reliable and up-to-date data.
CustoCentrix brings together the most commonly used types of analysis in the retail sector. These are presented in the form of graphs and tables which are easy to understand.
The results of every analysis can be exported to XLS files or graphs, which can then be used in presentations or analysis documents.
Here are a few examples:
Weekly, monthly or yearly change in footfall, average spend, average revenue per active customer, number of active customers, etc.
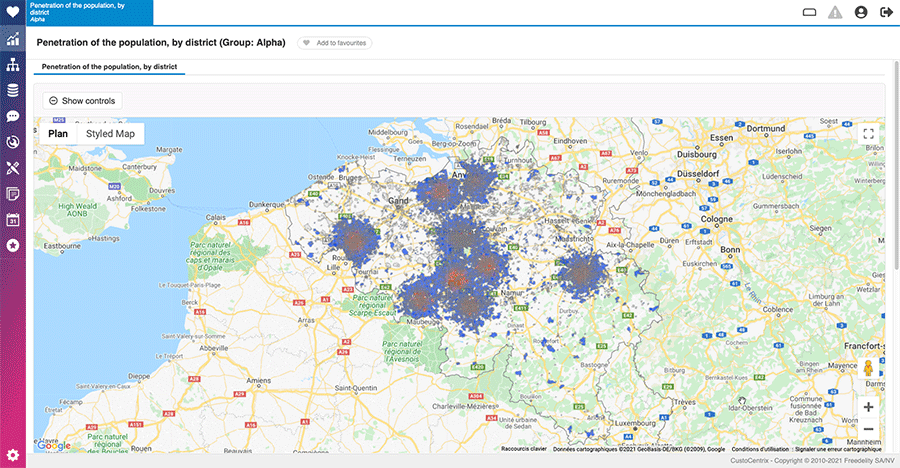
A map of the market penetration rate per municipality or statistical sector.
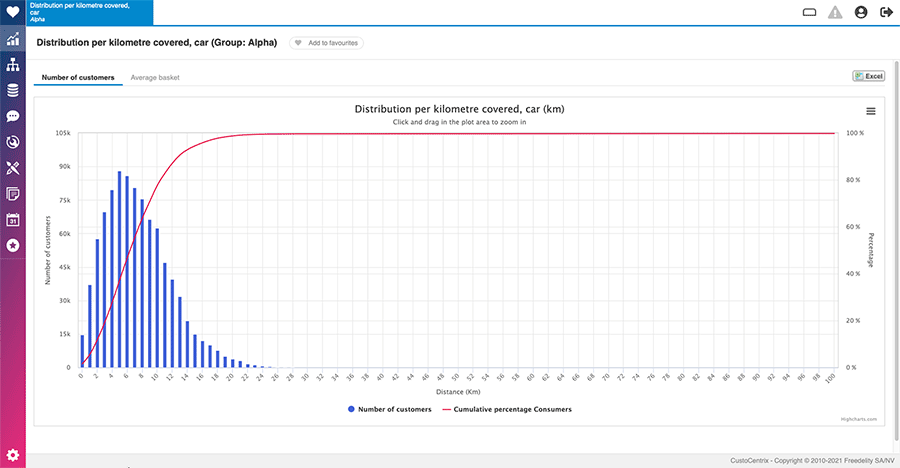
Charts showing the number of customers according to their drive time from each of the points of sale visited.
Distribution of turnover and footfall by day and time.
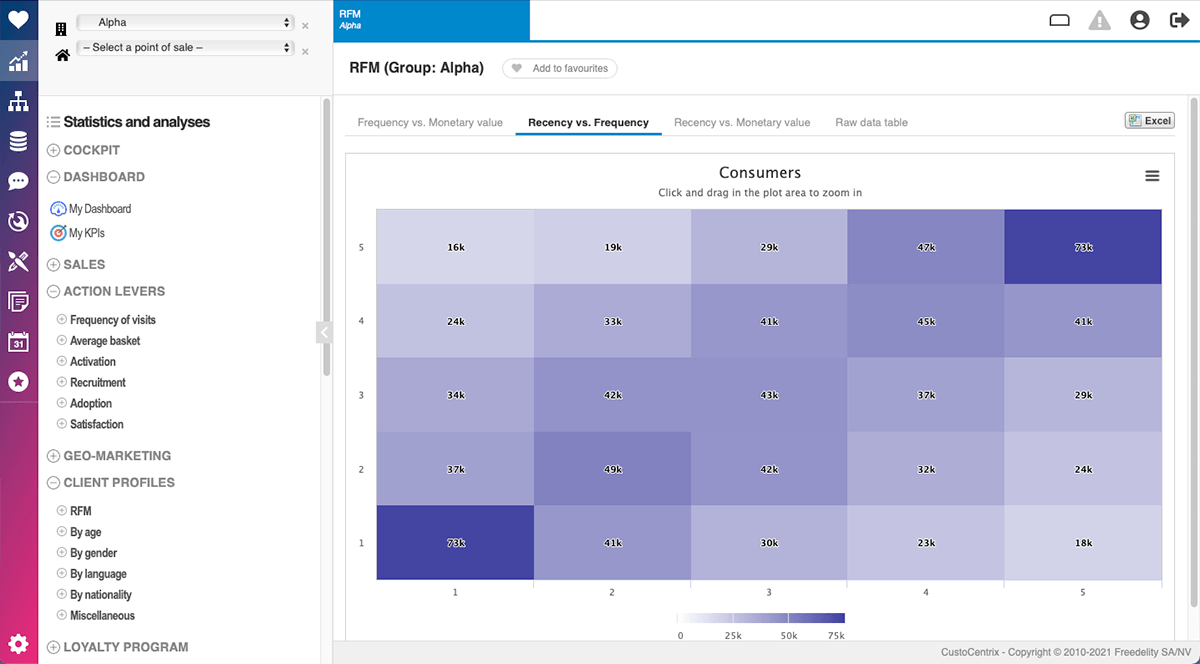
Analysis of the number of customers and the turnover by 'RFM' category (Recency, Frequency, Monetary value).
Analysis of the distribution of customers by age category and sex (in comparison with the reference population).
Comparison of performance between different points of sale based on various criteria.
CustoCentrix integrates the analyses most commonly used by marketing and sales departments in the retail sector.
This set of analyses changes regularly based on the requests made by the community of CustoCentrix users.
With CustoCentrix, it just takes one click to go from analysis to action.


